Data Analytics Bootcamp
- Online
- 2 Months
- 20th February
- Monday-Friday, 7:00 PM - 9:00 PM
Course Description
This two-month-long Data Analytics Bootcamp is designed to equip you with essential Data Analytics. It will guide you through Excel, Power BI, SQL, and Python, which is the main programming language used for data analysis.
We ensure you are not just job-ready but you can also kickstart your International career in Data Analytics. Join us on this journey and become future-ready in data analysis.
Course Curriculum
- Introduction to Data Literacy and Data?
- Definition and Characteristics of Data
- Types of Data: Structured, Unstructured, Semi-Structured
- Examples of Data in Various Contexts (e.g., Business, Healthcare, Education)
- Data Collection and Sources
- Methods of Data Collection: Surveys, Interviews, Observations, Sensors, etc.
- Primary vs. Secondary Data Sources
- Understanding Bias and Reliability in Data Collection
- Data Representation Techniques
- Introduction to Data Visualization
- Principles of Effective Data Visualization
- Types of Charts and Graphs: Bar Charts, Line Graphs, Pie Charts, Scatterplots
- Choosing the Right Visualization for Different Types of Data
- Introduction to Data Analysis
- Overview of Data Analysis Process
- Descriptive vs. Inferential Statistics
- Key Statistical Measures: Mean, Median, Mode, Standard Deviation, Range
- Introduction to Excel for Data Analysis
- Basics of Excel: Data Entry, Formulas, Functions
- Sorting and Filtering Data
- Introduction to PivotTables for Data Summarization and Analysis
- Data Ethics and Privacy
- Understanding Data Privacy and Security
- Ethical Considerations in Data Collection, Analysis, and Sharing
- Real-world Applications of Data Literacy
- Case Studies: Examples of Data Literacy in Different Industries (e.g., Marketing, Healthcare, Education)
Introduction to Data Communication
- Importance of effective data communication in decision-making.
Understanding Data Interpretation- Identifying trends, patterns, outliers, and correlations in data.
- Explaining the significance of findings to stakeholders.
Storytelling with Data- Emphasizing the importance of narrative structure in data communication.
- Structuring presentations or reports in a narrative format.
Data Narrative Techniques
- Crafting compelling data narratives using anecdotes, case studies, and real-world examples.
Data Communication Best Practices- Avoiding jargon and using plain language to communicate effectively.
- Providing context to help stakeholders understand the significance of the data.
Data Presentation Skills- Public speaking tips for delivering presentations confidently.
- Slide design principles for creating visually appealing presentations.
Data Storyboarding- Introduction to storyboarding as a planning tool for data presentations.
- Creating a visual roadmap for organizing key points in a presentation.
Feedback and Iteration- Importance of seeking feedback from stakeholders.
- Incorporating feedback into data communication efforts for continuous improvement.
- Crafting compelling data narratives using anecdotes, case studies, and real-world examples.
- Importance of effective data communication in decision-making.
Basic Data and Statistical Concepts
- Data Literacy
- Statistical Foundations
- Descriptive Statistics
- Statistical Inference and Sampling Techniques
- Regression Analysis
Data Cleaning, Preparation, and Management
- Data relationships, data shapes, and primary/unique keys and identifiers
- Basic data cleaning
- Data extraction from external sources
- Sorting, Filtering, and Merging Data
- Common excel formulas and functions
Further Concepts in Data Cleaning
- Excel Functions for Data Cleaning (E.g. Left, Right, Concatenate, etc)
- Conditional Formatting
- Data Validation and Error Checking
Basic Data Processing
- IF and Nested IF statements
- Absolute and Relative cell references
Data Analysis with Intermediate Excel
- Processing large datasets
- Find, Find & Replace
- Advanced Commands (VLookUp, HLookUp, Index, Match)
Introduction to Pivot Tables
- Navigating Pivot Tables Interface
- Creating basic Pivot Tables
- Field Settings and layout options
- Working with pivot table data
Advance Data Analysis with Pivot Tables
- Advanced pivot table functions
- Data slicing
- Pivot charts and visualizations
- Advanced Pivot table visualizations
Further Data Visualization on Excel
- Intermediate and Advanced Excel Charting Techniques
- Excel Add-ins for advanced visualization
- Data Analysis and Visualization on Google Sheets.
Introduction to PowerBI/ Connecting & Shaping Data
- Download and install Power BI Desktop, and adjust the settings.
- Understand the role that Power BI plays within the broader Microsoft ecosystem
- Explore core components of the Power BI Desktop interface
- Review the business intelligence workflow.
- Explore Power BI’s query editor and understand the role that Power Query plays in the larger BI workflow
- Introduce different types of connectors and connectivity modes available for getting data into Power BI
- Review tools for checking data quality and key profiling metrics like column distribution, empty values, errors, and outliers
- Transform tables using text, numerical and date/time tools, pivot and group records, and create new conditional columns
- Practice combining, modifying, and refreshing queries
Data Modeling
- Understand the basic principles of data modeling, including normalization, fact & dimension tables, and common schemas
- Create table relationships using primary and foreign keys, and discuss different types of relationship cardinality
- Configure report filters and trace filter context as it flows between related tables in the model
- Explore data modeling options like hierarchies, data categories, and hidden fields
DAX
- Introduce DAX fundamentals and learn when to use calculated columns and measures
- Understand the difference between row context and filter context, and how they impact DAX calculations
- Learn DAX formula syntax, basic operators and common function categories (math, logical, text, date/time, filter, etc.)
- Explore nested functions, and more complex topics like iterators and time intelligence patterns
Data Visualization
- Review frameworks and best practices for visualizing data and designing effective reports and dashboards
- Explore tools and techniques for inserting, formatting and filtering visuals in the Power BI Report view
- Add interactivity using tools like bookmarks, slicer panels, parameters, tooltips, and report navigation
- Learn how to configure row-level security with user roles
- Optimize reports for mobile viewing using custom layouts
Installing SQL Workbench
Introduction to SQL
- Overview of Database Management Systems(DBMS)
- Basic SQL syntax and structure
- Flow of SQL commands
- Data Types in SQL
- Running SQL commands using SELECT statement
- Retrieving data from tables
Filtering, Sorting, and Aggregating Data
- Using WHERE clause to filter data based on conditions
- Sorting query results using ORDER BY clause
- Limiting the number of results with LIMIT clause
- Using aggregate functions for summary statistics
- Grouping query results using GROUP BY clause
- Filtering grouped data with HAVING clause
Table Joins and Case Statements
- Case statements
- Understanding relationships between tables
- Using joins to combine data from multiple tables
Advanced Query Techniques
- Further practice with different types of joins
- Working with subqueries
- Working with derived tables
- Common table expressions (CTEs)
Window Functions and Data Modification
- Working with window functions
- Ranking data using RANK and DENSE_RANK
- Modifying data in tables using ALTER, RENAME, INSERT, UPDATE, DELETE
- Using UNION, INTERSECT, and EXCEPT to combine query results
Creating New Tables
- Further practice with window functions
- Creating new tables
- Inserting values into new tables
- Modifying and updating new tables
Advanced Topics and Artificial Intelligence
- Working with Primary Keys
- Auto-Increments
- Updating Tables
- Indexing
- Using AI in SQL programming
Date Variables and Artificial Intelligence
- Dealing with date variables in SQL data
- Setting variables in SQL
- Using AI in SQL programming
- Wrapping up
Introduction to Spatial Analysis
- Understanding Spatial Data: Definition, significance, and examples of spatial data.
- Spatial Data Types: Differentiating between vector and raster data.
- Applications of Spatial Analysis: Overview of how spatial analysis is used in various fields such as environmental science, urban planning, and public health.
- Introduction to GIS: Understanding Geographic Information Systems and their role in spatial analysis.
Introduction to QGIS
- Getting Started with QGIS: Installing QGIS and familiarizing with the interface.
- Basic Operations: Opening and viewing spatial data, navigating the map canvas, and managing layers.
- Data Import and Export: How to import and export different spatial data formats in QGIS.
Creating Shapefiles (Point, Line, and Polygon)
- Understanding Shapefiles: The structure and components of shapefiles.
- Creating New Shapefiles: Step-by-step guide to creating point, line, and polygon shapefiles.
- Editing Shapefiles: Adding, modifying, and deleting features in shapefiles.
Learning Basic Cartography
- Map Elements: Understanding essential map elements (title, legend, scale, north arrow).
- Design Principles: Color theory, symbolization, and layout design for clear and effective map-making.
- Creating Maps: Practical exercises to design maps using QGIS.
Learning Basic Vector Analysis Tools
- Spatial Queries: Selecting features based on spatial relationships (e.g., proximity, intersection).
- Buffer Analysis: Creating buffers around features and understanding their applications.
- Overlay Analysis: Performing spatial operations like intersect, union, and difference.
Creating Heatmaps
- Understanding Heatmaps: Concept and applications of heatmaps in representing data density.
- Generating Heatmaps in QGIS: Step-by-step guide to creating heatmaps from point data.
- Customization: Adjusting parameters to refine the heatmap visualization.
Using Google Maps to Create Maps in QGIS
- Integrating Google Maps: Methods to use Google Maps as basemaps in QGIS projects.
- Georeferencing: Aligning external map images with spatial data using georeferencing tools.
- Practical Exercise: Creating a map project in QGIS with Google Maps as the base layer.
Introduction to Raster Data
- Understanding Raster Data: Definition, structure, and examples of raster data.
- Raster Analysis Tools: Introduction to basic raster operations (e.g., map algebra, reclassification).
- Working with Satellite Imagery: Basics of accessing and analyzing satellite imagery in QGIS.
Real-World Examples of GIS in Various Industries and Fields
- Environmental Management: Use cases of GIS in conservation, pollution monitoring, and resource management.
- Urban Planning: Applications in zoning, infrastructure development, and traffic management.
- Public Health: Spatial analysis in epidemiology, access to healthcare facilities, and health outcome mapping.
- Agriculture: Precision farming, crop yield analysis, and soil mapping.
Installation
- Introduction to the Python programming language and its applications
- Setting up the Python environment: installation of Python and necessary libraries
- Configuring the development environment: IDEs, text editors, and Jupyter Notebook
Python Basics
- Introduction to Python: history, features, and advantages
- Expressions and operators: arithmetic, assignment, comparison, and logical
- Understanding type() function and type inference
- Introduction to data structures: lists, tuples, and dictionaries
Python Basics
- Recap of Python basics
- Working with arithmetic operators: addition, subtraction, multiplication, division, modulus, and exponentiation
- Using comparison operators: equal to, not equal to, greater than, less than, etc.
- Logical operators: and, or, and not
- Exploring advanced data types: sets and strings manipulation.
Expressions, Conditional Statements & For Loop
- Evaluating expressions: operator precedence and associativity
- Introduction to conditional statements: if, elif, and else
- Executing code based on conditionals.
- Understanding the flow of control in conditional statements
- Iteration using the for loop: range(), iteration over lists, and strings.
While loop, Break and Continue Statements, and Nested Loops
- Working with while loop: syntax, conditions, and examples
- Combining loops and conditionals
- Using the break statement to exit loops prematurely.
- Utilizing the continue statement to skip iterations.
- Implementing nested loops for complex iterations
Functions
- Introduction to functions: purpose, advantages, and best practices
- Defining and calling user-defined functions
- Parameters and arguments: positional, keyword, and default values
- Return statement and function output.
- Variable scope and lifetime
- Function documentation and code readability
Exception Handling and File Handling
- Understanding exceptions: errors, exceptions, and exception hierarchy
- Handling exceptions using try-except blocks: handling specific exceptions, multiple exceptions, and else and finally clauses.
- Raising exceptions and creating custom exception classes
- File handling in Python: opening, reading, writing, and closing files.
- Working with different file modes and file objects
Python Modules: NumPy and Matplotlib
- Introduction to the NumPy module: features and applications
- Working with multidimensional arrays: creation, indexing, slicing, and reshaping
- Performing element-wise operations: arithmetic, logical, and statistical
- Overview of the Matplotlib module: data visualization and plotting
- Customizing plots: line properties, markers, colors, labels, and legends
Mathematics for Data Science
- Vectors and Matrices: Definition, addition, scalar multiplication.
- Matrix Multiplication: Concept and application in data transformation and neural networks.
- Eigenvalues and Eigenvectors: Importance in dimensionality reduction techniques like PCA
- Derivatives and Gradients: Understanding how changes in input affect changes in output.
- Partial Derivatives and the Gradient Vector: Application in gradient descent and optimization.
- Introduction to Optimization: Concept of loss functions and how gradients are used to minimize them.
- Probability Theory: Basics and conditional probability.
- Bayes' Theorem: Importance in machine learning for making predictions.
- Descriptive Statistics: Mean, median, mode, variance, and standard deviation.
- Distributions: Normal distribution and its significance in machine learning.
- Beyond Gradient Descent: Introduction to stochastic gradient descent and mini-batch gradient descent.
- Regularization Techniques: L1 (Lasso) and L2 (Ridge) regularization to prevent overfitting.
- Introduction to Convex Optimization: Understanding convex functions and their relevance to machine learning optimization.
Introduction and Missing Value Analysis
- Introduction to Exploratory Data Analysis (EDA)
- Importance of EDA in data analysis
- Steps involved in EDA
- Handling missing values: identification, analysis, and treatment strategies • Imputation techniques for missing values
Data Consistency, Binning, and Outlier Analysis
- Data consistency checks using fuzzy logic
- Binning and discretization techniques for continuous variables
- Outlier detection and analysis methods
- Handling outliers: techniques for treatment or removal
Feature Selection and Data Wrangling
- Importance of feature selection in EDA
- Feature selection techniques: filter methods, wrapper methods, and embedded methods
- Data wrangling: cleaning and transforming data for analysis
- Handling categorical variables: encoding techniques
Inference, Hypothesis Testing, and Visualization
- Inference and hypothesis testing in EDA
- Common statistical tests: t-test, chi-square test, ANOVA, etc.
- Visualization techniques for EDA: histograms, box plots, scatter plots, etc.
- Hands-on practical session for complete EDA using a dataset
Email Writing
- Basics of Professional Email Communication: Structure, tone, and etiquette.
- Writing Effective Subject Lines: Techniques to ensure your emails are opened.
- Emails for Networking: Approaching professionals and mentors in data science/AI.
- Follow-up Emails: Strategies for following up without being intrusive.
Report Writing + Presentations
- Structure of a Data Science Report: Elements including abstract, methodology, results, and conclusion.
- Visualizing Data: Incorporating charts, graphs, and other visual tools to enhance comprehension.
- Creating Engaging Presentations: Tips for PowerPoint, storytelling, and engaging your audience.
- Presentation Skills: Delivering your message confidently, handling Q&A sessions.
LinkedIn Optimization
- Building a Professional Profile: Key components of a LinkedIn profile for data science/AI professionals.
- Networking Strategies: Connecting with industry professionals and joining relevant groups.
- Content Sharing and Creation: Establishing thought leadership by sharing insights, articles, and engaging with community content.
Resume/CV Writing
- Tailoring Your Resume for Data Science/AI: Highlighting relevant skills, projects, and experiences.
- Action Verbs and Quantifiable Achievements: Demonstrating impact in previous roles or projects.
- Design and Layout: Making your resume/CV visually appealing and easy to read.
Cover Letter
- Structure of a Cover Letter: Introduction, body, and closing.
- Customizing Your Message: Researching the company and role to personalize content.
- Highlighting Fit and Value: Articulating how your skills and experiences align with the job requirements.
Freelancing
- Getting Started with Freelancing: Platforms for data science/AI freelancers, setting up a profile.
- Finding Projects and Clients: Strategies to secure freelance work and build a portfolio.
- Pricing Your Services: Understanding market rates and value-based pricing.
- Client Management: Communicating effectively and managing expectations.
Kaggle for Data Science
- Introduction to Kaggle: Overview of the platform, competitions, datasets, and notebooks.
- Participating in Competitions: Tips for success, collaboration, and learning from the community.
- Building a Portfolio: Using Kaggle to showcase your skills and projects to potential employers.
GitHub
- Why GitHub for Data Scientists: Importance of version control and code sharing.
- Creating and Managing Repositories: Best practices for organizing and documenting projects.
- Collaborating on Projects: Contributing to open-source projects and collaborating with others.
- GitHub as a Portfolio: Presenting your work and contributions to potential employers.
How to Crack Data Analysis Interviews
- Understanding the Interview Process: Types of interviews (technical, behavioral, case studies).
- Preparing for Technical Interviews: Common questions, coding challenges, and statistical questions.
- Behavioral Interview Preparation: Crafting your story, STAR method for responses.
- Mock Interviews: Practicing with peers or mentors to gain confidence.
Global Market Understanding
- Data Science/AI Trends: Understanding global trends and emerging technologies.
- Cultural Competence: Working in multicultural teams and serving diverse user bases.
- Regulatory Environment: Overview of data privacy laws and ethical considerations in different regions.
Storytelling Using Data
- Principles of Data Storytelling: Crafting narratives that resonate with your audience.
- Visual Narrative Techniques: Using data visualizations effectively in your story.
- Engaging Presentations: Combining data, visuals, and narrative for impactful presentations.
Intro to Data Commons
- Understanding Data Commons: Concept, importance, and examples.
- Accessing and Contributing to Data Commons: Guidelines and best practices.
STANDARD MONTHLY
-
For 2 Months
LUMPSUM
-
For 2 Months
Check your Eligibility
Currently enrolled or have graduated with a bachelor’s degree.
Complete our Bootcamp and Become Job Ready
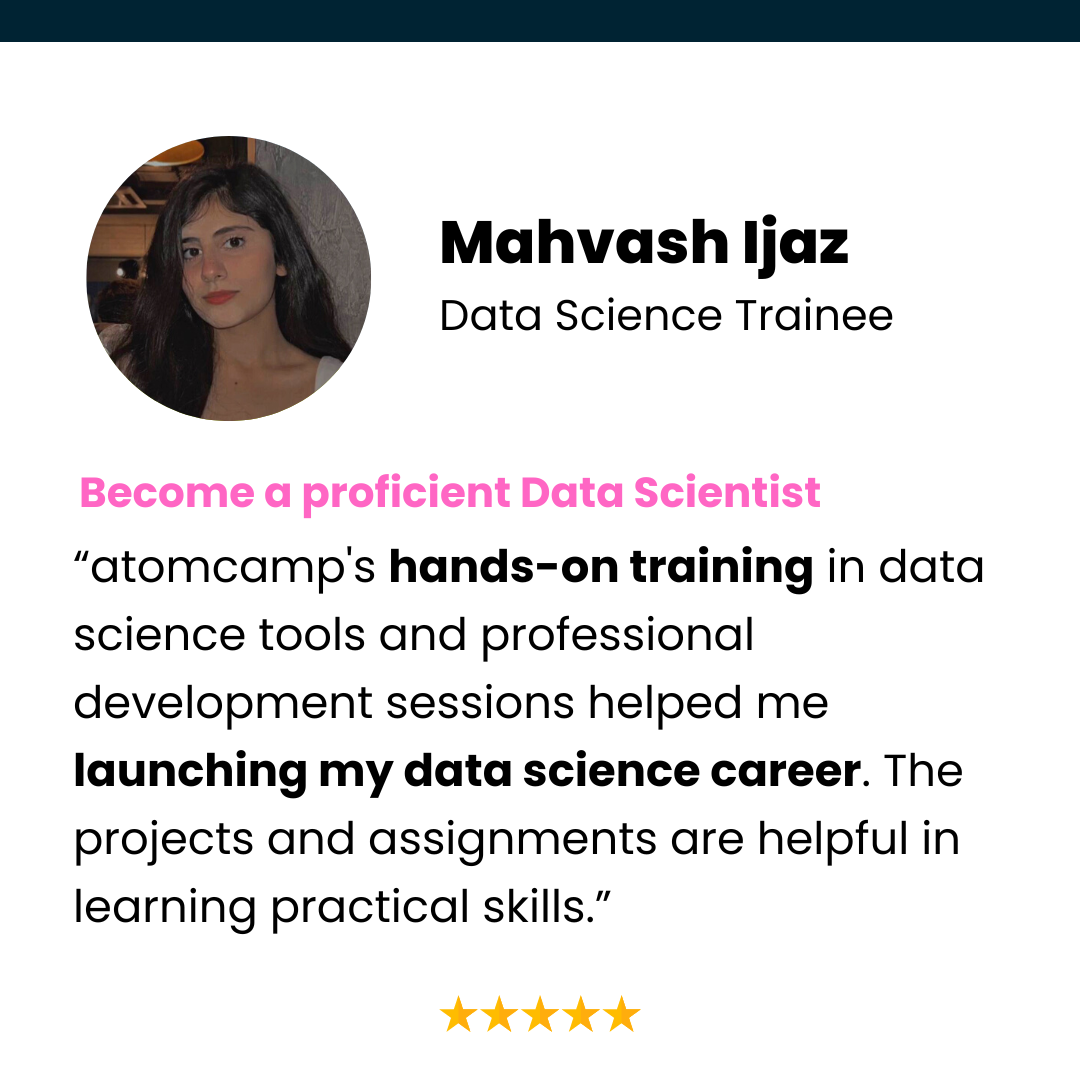
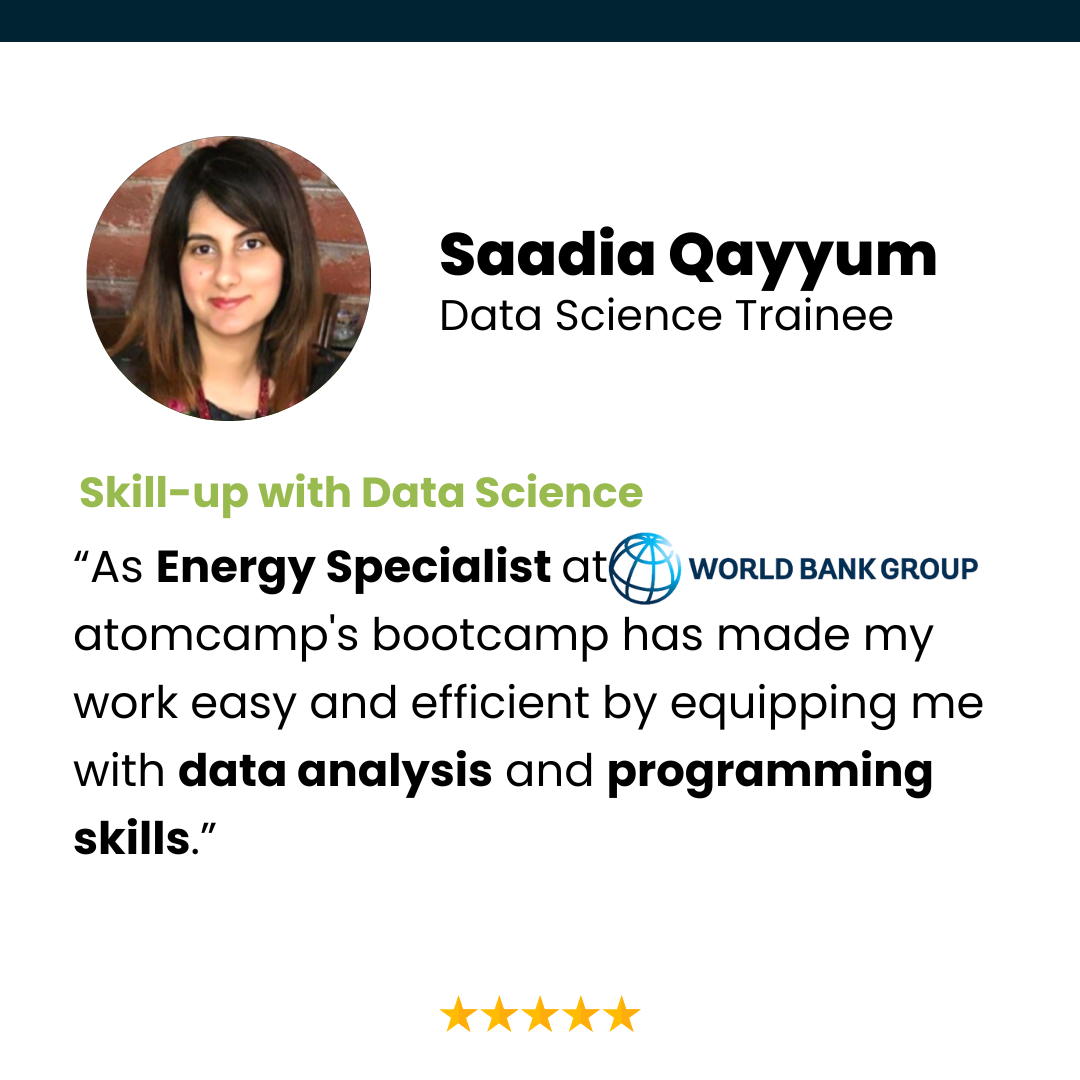
We help our successful graduates find Jobs and Internships, and also provide guidance in discovering Freelance opportunities.



Key Features
Industry Ready Portfolio
Craft a portfolio that showcases your industry-ready data science projects.
Enhance your career by learning Data Science and AI skills.
Strengthen your data skills and excel in your existing career.


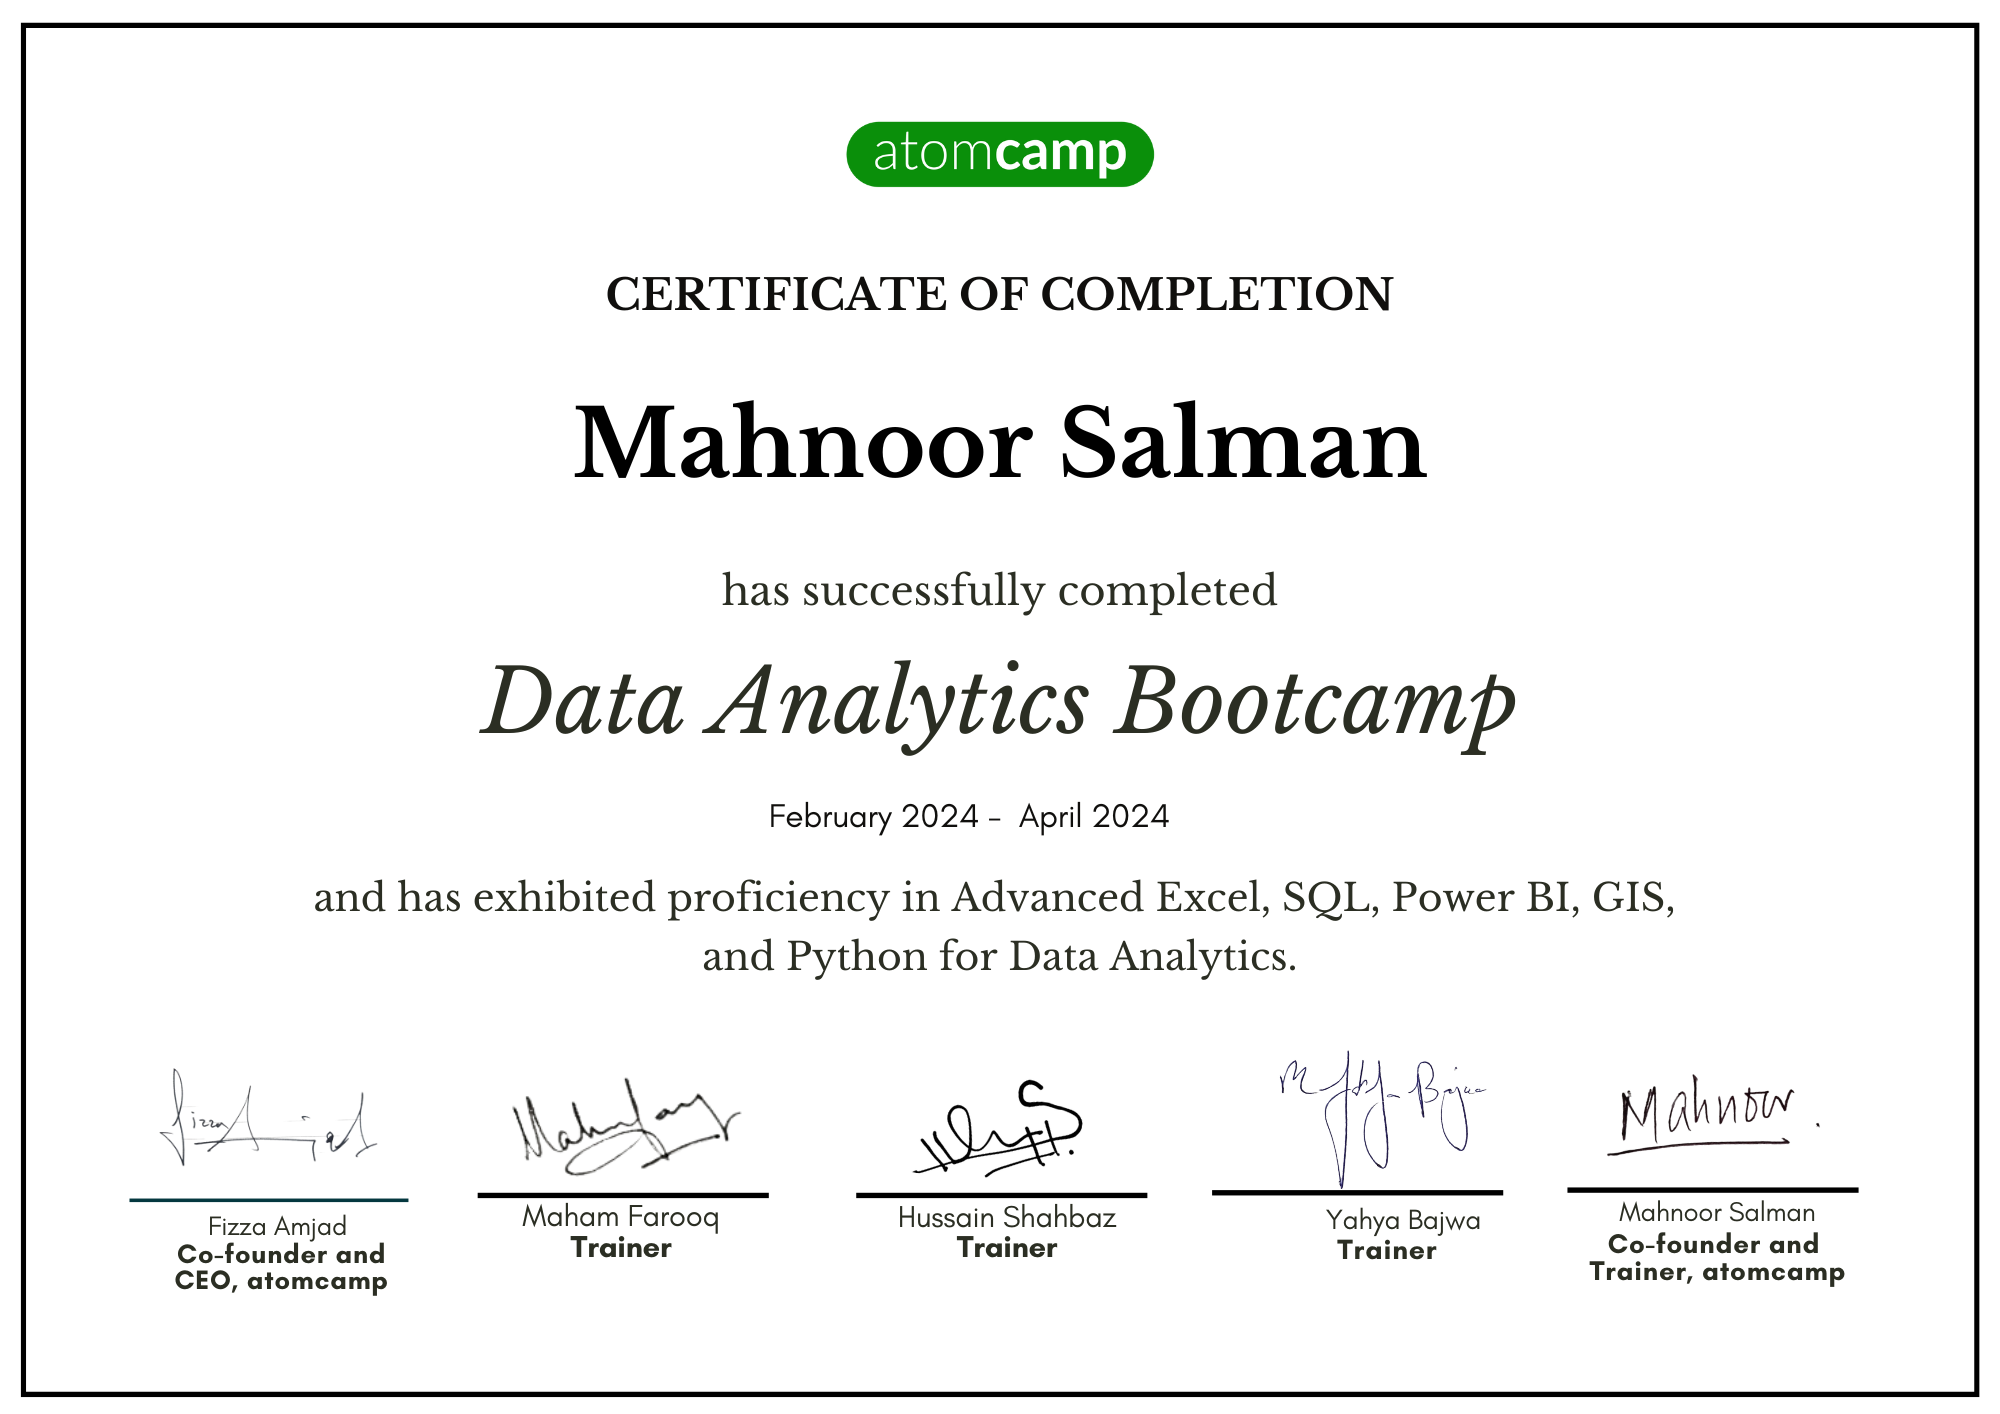
Earn a Verified Certificate of Completion
Earn a data analytics certificate, verifying your skills. Step into the market with a proven and trusted skillset.
Potential Job Route
Data Analyst
The most direct route, involving tasks such as collecting, processing, and performing statistical analyses on large datasets. Data analysts help organizations make informed business decisions by identifying trends, patterns, and insights.
BI Analyst
Business Intelligence Analysts use data to help companies make better business decisions. They work with data visualization tools like Power BI or Tableau to create dashboards and reports that provide actionable insights.
Product Analyst
Product analysts focus on product performance, user behavior, and market trends. They help product teams make data-driven decisions to improve product development and marketing strategies.
Trusted By Leading Companies


Pricing Plans
STANDARD MONTHLY
-
Standard Monthly
-
For 2 Months
LUMPSUM PAYMENT
-
Lumpsum (Advance Payment)
-
For 2 Months
Frequently Asked Questions
Classes run five days a week, ensuring an immersive and engaging learning experience.
Our bootcamp explores cutting-edge data science technologies, covering machine learning, data analysis, and essential programming languages.
Absolutely! Active participation is crucial, with 80% attendance required for certification.
Yes, participants dive into hands-on assignments, reinforcing learning and practical application.
We recommend investing 2 extra hours daily to dive into materials, ace assignments, and truly embrace the learning journey.
Our bootcamp features live training sessions, providing real-time interaction with instructors and peers.
Fulfill attendance, engage actively, complete assignments, and demonstrate proficiency in the taught skills.
Regular attendance is encouraged, but we understand life happens. Communicate any issues, and we'll support your journey.
Yes, we host Teaching Assistant (TA) sessions for reviewing material, clarifying concepts, and addressing queries.
This series focuses on soft skills, industry awareness, and career readiness, ensuring you're well-equipped for success in data science.


